

LSA: Law School Clusters
(Cross-posted to Law School Almanac)
After pointing out the more severe flaws in the Legal Education Value Added Rankings, I spent some time reading Linda Wightman's LSAC National Longitudinal Bar Passage Study (based on a cohort of students who started law school in 1991). With respect to "valued added" concepts in legal education, one conclusion of this study stands out: LSAT scores and law school GPA have the strongest predictive value for bar passage rates, but results for students with the same LSAT and LGPA differ significantly between certain of the six "clusters" of schools which the study identified.
Wightman identified one group of schools ("Cluster 3") in which students having the same LSAT score and LGPA seemed to have higher success in passing the bar relative to several other clusters. And she found the greatest gap between the success of students with the same LSAT and LGPA who attend schools in Cluster 6 vs. those in Cluster 3. There were lesser gaps in outcomes for schools in Clusters 2 and 5 compared with those in Cluster 3. And two of the clusters (1 and 4) had no significant difference in success rates from Cluster 3 (also an interesting conclusion). Finally, the differences were greatest between students attending schools in different clusters when those students had a lower LSAT score and law school GPA.
Click here to read the rest of this post . . . .Wightman points out that the study does not establish any causal connection between attending schools in different clusters. And it is a little hard to identify example schools from the various clusters, not the least because for most schools the values of the variables involved in the study have shifted greatly in the past seventeen years. But regardless what schools made up what clusters in 1990, Wightman's basic method remains compelling -- finding significant variables on which law schools tend to naturally cluster, and then examining how outcomes differ between those clusters.
I'm trying now to understand the math behind the clustering procedure and to repeat the process using current data, to see what clusters might emerge today. As a first step in that process, I composed data from the ABA Official Guide to Law Schools (2008 Edition) to replicate the variables Wightman described in her smaller study: Clustering Law Schools Using Variables That Describe Cost, Selectivity, and Student Body Characteristics (PDF). I've only gotten as far as calculating summary statistics and Z-scores, but those results seemed striking enough to merit posting on their own (*). The variables Wightman used for clustering and which I have recalculated are:
ENROLL FT: Full-time enrollment
S/F RATIO: Student to faculty ratio
MIN %: Percent minority enrollment (first-year)
ACC %: Acceptance rate (total)
LSAT: Median LSAT for entering full-time students
UGPA: Median undergraduate GPA for entering full-time students
TUITION: Full-time resident tuition and fees
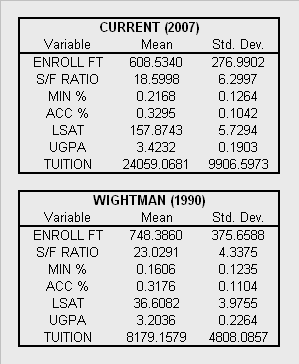
I have not done any hypothesis tests to determine which changes are statistically significant, but just eyeballing the data seems to reveal some notable shifts.
Enrollment: The mean and standard deviation have both dropped, suggesting a convergence of all schools toward lower full-time enrollment.
Faculty: The S/F ratio has dropped by a good bit, but the standard deviation has widened. Schools seem to be employing noticeably more faculty overall, but they may also have scattered quite a bit in the magnitude and direction of change on this measure.
Minorities: The mean percentage of minority enrollment has increased from 16% to 21%, but the standard deviation is about the same -- basically the entire curve took a step to the right. One question we may have is which minorities are counted for the purpose of "minority enrollment." I am not sure whether Wightman's figures only include certain minorities, or if she used the Total Minority numbers from the ABA as I did (and as I assumed she did).
Selectivity: The overall distribution of acceptance rates has hardly changed at all, but academic index parameters have changed a lot. Schools as a whole appear to have become much more selective on GPA and much less selective on LSAT scores. Wightman's studies uses LSAT scores from the old scale, and I could not find a score percentile table from 1991 anywhere online (if anyone out there happens to have a copy of one, please let me know). I made a rough attempt to equate the scoring scales, from which I guessed that a 36 on the old scale was around the 85th percentile. The current mean of 158 falls at the 75th percentile. Median GPAs, meanwhile, have shifted upward more than 0.20, but the standard deviation has stayed about the same. Here again, it looks like the whole curve just shifted right by quite a bit (grade inflation, anyone ... ?).
Cost: The standard deviation for total tuition and fees today is larger than the mean was seventeen years ago -- enough said.
(*) As Wightman did, I excluded a handful of schools from these statistics: 1) The three ABA approved schools in Puerto Rico; and 2) The "one law school that enrolls part-time students almost exclusively."
After pointing out the more severe flaws in the Legal Education Value Added Rankings, I spent some time reading Linda Wightman's LSAC National Longitudinal Bar Passage Study (based on a cohort of students who started law school in 1991). With respect to "valued added" concepts in legal education, one conclusion of this study stands out: LSAT scores and law school GPA have the strongest predictive value for bar passage rates, but results for students with the same LSAT and LGPA differ significantly between certain of the six "clusters" of schools which the study identified.
Wightman identified one group of schools ("Cluster 3") in which students having the same LSAT score and LGPA seemed to have higher success in passing the bar relative to several other clusters. And she found the greatest gap between the success of students with the same LSAT and LGPA who attend schools in Cluster 6 vs. those in Cluster 3. There were lesser gaps in outcomes for schools in Clusters 2 and 5 compared with those in Cluster 3. And two of the clusters (1 and 4) had no significant difference in success rates from Cluster 3 (also an interesting conclusion). Finally, the differences were greatest between students attending schools in different clusters when those students had a lower LSAT score and law school GPA.
Click here to read the rest of this post . . . .Wightman points out that the study does not establish any causal connection between attending schools in different clusters. And it is a little hard to identify example schools from the various clusters, not the least because for most schools the values of the variables involved in the study have shifted greatly in the past seventeen years. But regardless what schools made up what clusters in 1990, Wightman's basic method remains compelling -- finding significant variables on which law schools tend to naturally cluster, and then examining how outcomes differ between those clusters.
I'm trying now to understand the math behind the clustering procedure and to repeat the process using current data, to see what clusters might emerge today. As a first step in that process, I composed data from the ABA Official Guide to Law Schools (2008 Edition) to replicate the variables Wightman described in her smaller study: Clustering Law Schools Using Variables That Describe Cost, Selectivity, and Student Body Characteristics (PDF). I've only gotten as far as calculating summary statistics and Z-scores, but those results seemed striking enough to merit posting on their own (*). The variables Wightman used for clustering and which I have recalculated are:
ENROLL FT: Full-time enrollment
S/F RATIO: Student to faculty ratio
MIN %: Percent minority enrollment (first-year)
ACC %: Acceptance rate (total)
LSAT: Median LSAT for entering full-time students
UGPA: Median undergraduate GPA for entering full-time students
TUITION: Full-time resident tuition and fees
I have not done any hypothesis tests to determine which changes are statistically significant, but just eyeballing the data seems to reveal some notable shifts.
Enrollment: The mean and standard deviation have both dropped, suggesting a convergence of all schools toward lower full-time enrollment.
Faculty: The S/F ratio has dropped by a good bit, but the standard deviation has widened. Schools seem to be employing noticeably more faculty overall, but they may also have scattered quite a bit in the magnitude and direction of change on this measure.
Minorities: The mean percentage of minority enrollment has increased from 16% to 21%, but the standard deviation is about the same -- basically the entire curve took a step to the right. One question we may have is which minorities are counted for the purpose of "minority enrollment." I am not sure whether Wightman's figures only include certain minorities, or if she used the Total Minority numbers from the ABA as I did (and as I assumed she did).
Selectivity: The overall distribution of acceptance rates has hardly changed at all, but academic index parameters have changed a lot. Schools as a whole appear to have become much more selective on GPA and much less selective on LSAT scores. Wightman's studies uses LSAT scores from the old scale, and I could not find a score percentile table from 1991 anywhere online (if anyone out there happens to have a copy of one, please let me know). I made a rough attempt to equate the scoring scales, from which I guessed that a 36 on the old scale was around the 85th percentile. The current mean of 158 falls at the 75th percentile. Median GPAs, meanwhile, have shifted upward more than 0.20, but the standard deviation has stayed about the same. Here again, it looks like the whole curve just shifted right by quite a bit (grade inflation, anyone ... ?).
Cost: The standard deviation for total tuition and fees today is larger than the mean was seventeen years ago -- enough said.
(*) As Wightman did, I excluded a handful of schools from these statistics: 1) The three ABA approved schools in Puerto Rico; and 2) The "one law school that enrolls part-time students almost exclusively."
posted by Michael Shaffer at 8:52 PM
![]()
![]()


3 Comments:
Could I ask some questions that will help me understand what is going on?
1. In the original study were the cluster based on anything other than the relationship between entering qualifications and bar passage?
2. In other words did they differ with respect to any of the other variables that you have now updated?
3. Have you used any kind of grade deflater to put 2008 grades in terms of 1991 grades?
Thanks. J
Thanks for the questions, Jeff.
1) The clusters were based only on input measures, so they do not include any output metrics like bar passage, or correlations of inputs and outputs.
Wightman performed the clustering before doing any analysis of inputs vs. outputs. Her smaller study above only relates to the clustering methods used, the variables chosen for clustering, and validation of the results.
Her goal was to identify a series of variables on which law schools differed significantly, and then to identify an optimal number of clusters into which to sort them on these variables.
Wightman started with a list of variables that included the ones I calculated here, as well as percent female enrollement and public vs. private affiliation. But she threw out female enrollment and affiliation, because the former did not vary significantly across schools and the latter was so closely correlated with tuition that she found it redundant.
The main purpose of clustering for the larger work (the National Longitudinal Bar Passage Study) was to aggregate results from minority students at different schools in a valid way. According to the NLBPS, without clustering the sample sizes at some schools would have been too small for minority groups (or at least for some groups).
Wightman does not point this out, but clustering also plainly allows stating conclusions about outcomes between significantly different categories of schools without "naming names."
2) Yes.
The clusters of schools differed significantly from each other with respect to the variables shown above (enrollment, cost, selectivity). Wightman used different techniques both to test the differences between clusters and to validate the number of clusters chosen and the association of schools with clusters.
In the NLBPS, significant differences in probability of passing the bar were found for students with the same LSAT and LGPA values who attended schools in certain of the different clusters.
3) No.
I didn't attempt to adjust grades or LSAT scores in any way to equate them, so the difference is between raw reported numbers.
The neat thing about Wightman's clustering method is that it also allows -- providing you find differences in outcomes -- making some valid guesses about best practices. We could think about adding some new variables like those that Jason Solomon suggested: measures of scholarly impact, participation in and use of LSSSE results, Princeton review student survey scores, etc.
If we find schools that cluster in significantly different groups on the variables we choose, and if outcomes differ for students with the same academic metrics (LSAT / LGPA), then we might have good reason to investigate the relationship between our cluster variables and student outcomes.
Post a Comment
<< Home