How Top-Ranked Law Schools Got That Way, Pt. 2
In the first post in this series, I discussed the mysterious distribution of maximum z-scores in the top two tiers of law schools in U.S. News & World Report's 2010 rankings, and focused on the top-12 schools to solve that mystery. In brief, among the very top schools, employment nine months after graduation" ("Emp9") varies too little to make much of a difference in the schools' overall scores, whereas overhead expenditures/student ("Over$/Stu") varies so greatly as to almost swamp the impact of the other factors that USN&WR uses in its rankings. Here, in part two, I focus on the top 22 law schools in USN&WR's 2010 rankings. In addition to the Emp9 and Over$/Stu effects observed earlier, this wider study uncovers some other interesting patterns.

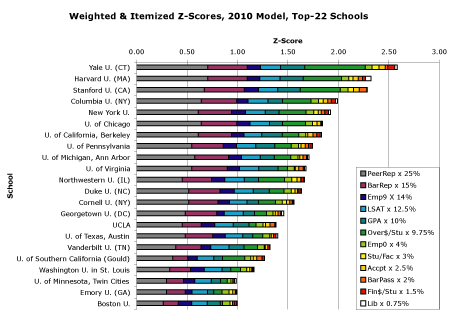
The above graph, "Weighted & Itemized Z-Scores, 2010 Model, Top-22 Schools," offers a snapshot comparison of how a wide swath of the top schools performed in the most recent USN&WR rankings. It reveals that the same effects we observed earlier, among just the top-12 schools, reach at least another ten schools down in the rankings. With the exception of Emory and Georgetown, Emp9 scores (indicated by the dark blue band) barely change from one top-22 school to another. Over$/Stu scores, in contrast (indicated by the middle green hue), vary widely; compare Yale's extraordinary performance on that measure with, for instance, Boston University's.
This graph also reveals some other interesting effects. Like the Emp9 measure, the Emp0 measure (for "Employment at Graduation," indicated in yellow-green) varies little from school to school. Indeed, it varies even less than the Emp9 measure does. Why so? Because all of these top schools reported such high employment rates. All but Minnesota reported Emp0 rates above 90%, and all but Georgetown, USC, and Washington U. reported rates above 95%.
These top 22 schools also reported very similar LSATs. Their weighted z-scores for that measure, indicated here in light blue, range from only.20 to .15. The weighed z-scores for GPA, in contrast, marked in dark green, range from .24 to .06.
As the graph indicates, the measures worth 3% or less of a school's overall score—student/faculty ratio, acceptance rate, Bar exam pass rate, financial aid expenditures/student, and library volumes and equivalents—in general make very little difference in the ranking of these schools. One exception to that rule pops up in the BarPass scores (in dark orange) of the California schools, which benefit from a quirk in the way that USN&WR measures Bar Pass rates. Another interesting exception appears in Harvard's Lib score (in white)—only thanks to its vastly larger law library does Harvard edge out Stanford in this ranking.
To best understand how a few law schools made it to the top of USN&WR's rankings, we should contrast their performances with those of the many schools that did not do as well. I'll thus sample the statistics of the law schools that ranked 41-51 in the most recent USN&WR rankings, those that ranked 94-100, and the eight schools that filled out the bottom of the rankings. Please look for that in the next post.
[Crossposted at Agoraphilia, MoneyLaw.]
Labels: law school rankings, U.S. News


1 Comments:
The article is very interesting... Great post... Hope to read more from you... Keep it coming... God bless...
Post a Comment
<< Home