Tuesday, June 12, 2012

Accuracy of Model of the 2013 USN&WR Law School Rankings

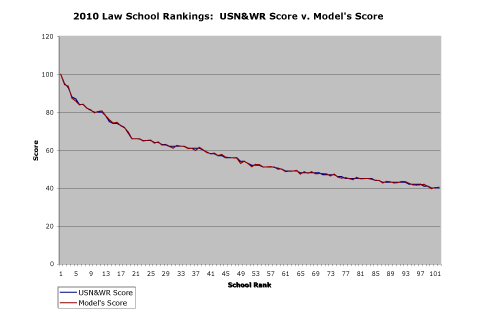
As in every year since 2005, I’ve again built a model of the U.S. News & World Report ("USN&WR") law school rankings. This latest effort generated a record-high r-squared coefficient: .998673. More about what that means—and more about the one law school that doesn’t fit—below. First, here’s a snapshot comparison of the scores of the most recent (USN&WR calls them “2013”) law school rankings and the model:


As that graphical comparison indicates, the model replicated USN&WR’s scores very closely. Indeed, the chart arguably overstates the differences between the two sets of scores because it shows precise scores for the model but scores rounded to the nearest one for USN&WR.

As I mentioned above, comparing the two data sets generates an r-squared coefficient of .998673. That comes very close to an r-squared of 1, which would show perfect correlation between the two sets of scores. Plainly, the model tracks the USN&WR law school rankings very closely.

In most cases, rounding to the nearest one, the model generated the same scores as those published by USN&WR. In four cases, the scores varied by 1 point. That’s not enough of a difference to fuss over, given that small variations inevitably arise from comparing the generated scores with the published, rounded ones. Consider, for instance, that USN&WR might have generated a score of 87.444 for the University of Virginia School of Law and published it as “87.” The model calculates Virginia’s score in the 2013 rankings as 88.009. The rounded and calculated scores differ by 1.009. But if we could compare the original USN&WR score with the model’s score would get difference of only .565 points. I won’t worry over so small a difference.

You know what does worry me, though? Look at the far right side of the chart above. That red “V” marks the 4.48 difference between the 34 points USN&WR gave to the University of Idaho School of Law and the score that the model generated. Idaho showed a similar anomaly in last year’s model, though then it was not alone. This year, only Idaho does much better in the published rankings than in the model.

[Crossposted at Agoraphilia and MoneyLaw.]

Labels: ,

Tuesday, May 22, 2012

U.S. News & World Report Improves Transparency of Law School Rankings

Huzzah for U.S. News and World Report! The most recent edition of its law school rankings includes the median LSAT and GPA of each school’s entering class. Finally. I have long argued that USN&WR should publish all of the data that it uses in its rankings. How else can the rest of us (read: rankings geeks) understand how—and, indeed, whether—the rankings work? Though USN&WR remains short of that ideal, disclosing median LSATs and GPAs represents a major step towards making the rankings more transparent and, thus, trustworthy.

USN&WR started the trend towards transparency last year, when it began publishing the “volume and volume equivalents” measures that it uses in its law school rankings. That input counts for only .75% of a school’s score, however. Median LSATs and GPAs together count for 22.5% of a school’s score, in contrast, making their disclosure by USN&WR all the more helpful.

There remain only two categories of data that USN&WR still uses in its law school rankings but does not disclose: overhead expenditures/student (worth 9.75% of a school’s score in the rankings) and financial aid expenditures/student (worth 1.5%). It isn’t evident why USN&WR declines to publish those inputs, too, though perhaps the financial nature of the data raises special concerns. If USN&WR cannot bring itself to publish overhead expenditures/student and financial aid expenditures/student, however, it should abandon those measures. They serve as poor proxies for the quality of a school’s legal education and if we cannot double-check the figures we cannot trust their accuracy.

[Crossposted at Agoraphilia and MoneyLaw.]

Labels: , ,

Thursday, December 16, 2010

Z-Scores in Model of 2011 USN&WR Law School Rankings

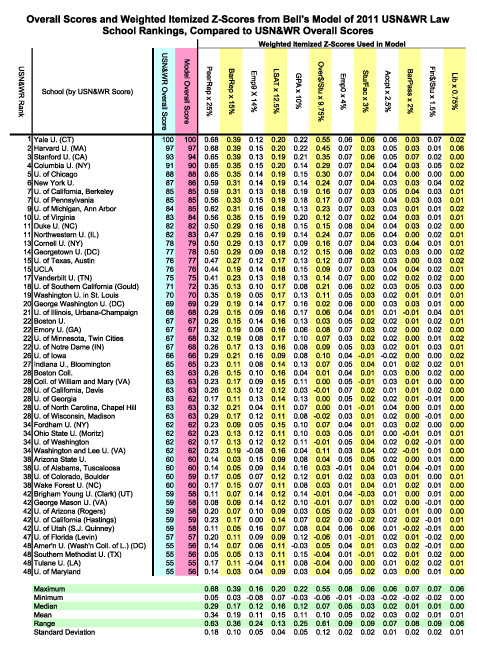
As I have for each of the past several years, I this year again built a model of the most recent U.S. News and World Report ("USN&WR") law school rankings. This year's model matched the publishing rankings very nicely; comparing the model's scores with the published ones generated an r-squared of .997 (where 1 would indicate perfect correspondence). At the request of my readers, I here offer the weighted z-scores of the top-tier schools from last spring's (the "2011") USN&WR law school rankings:

Z-Scores from Model of USN&WR 2011 Law School Rankings

Why do my fellow rankings geeks care about z-scores? In brief, these z-scores measure how well each school performed relative to its peers, thereby establishing its rank. (See here for a fuller explanation.) Because USN&WR uses z-scores to rank law schools, so too must any model of its rankings.

I weighted these z-scores simply by multiplying the z-score for each school, in each category of data, by the percentage that that category influences a school's overall score in USN&WR's rankings. That method of presenting z-scores has the virtue of highlighting which scores matter the most. You will thus generally find the largest weighted z-scores in the upper, left-hand corner of the chart, for instance, where lie both the most important categories of data and the law schools that scored the highest the rankings.

Consider, for instance, the weighted z-scores of .68 enjoyed by both Yale and Harvard under the "PeerRep" category. Numbers that large (comparatively speaking) overwhelm the effect of other measures of those schools' performances—the schools' BarRep scores, at .39 each, come in a distant second—and have twice the impact of the peer reputation scores of schools ranked as close as 20th from the top.

Using weighted z-scores also has the virtue of showing how very little influence many of the things that USN&WR measures have on its rankings. The weighted z-scores for Bar pass rates among top-tier schools, for instance, vary between only .07 and -.02.. Bar pass rates, however important to students, evidently do not matter much in USN&WR rankings.

Why did it take me so long to finish this year's model? In large part, you can blame my prepping two new classes (Property and a Law & Economics seminar) and serving on Chapman's Dean Search Committee (an effort that should soon conclude with our announcment of a fantastic new leader for our law school). Notably, though, some of the delay stems from how the ABA manages its statistical take-offs. The ABA recently abandoned its former practice of routinely sending electronic copies of its statistical take-offs at the request of any subscribing school. Allegedly, some Deans had complained that to make the data available electronically would make modeling the USN&WR rankings too easy. Nice try, Deans! Also, the ABA this year neglected to send several subscribing schools, including my own, even hardcopies of the statistical takeoffs. We got a prompt response from the ABA when we finally figured out that we we were not to blame for the missing take-offs, but the mix up still impeded my efforts. Again, though, geekery finally prevailed.

Interested in prior years' z-scores? Here are the ones from the 2010 rankings, the 2008 rankings, the 2007 rankings, the 2006 rankings, and the 2005 rankings.

[Crossposted at Agoraphilia, MoneyLaw.]

Labels: ,

Thursday, May 20, 2010

U.S. News: Less Transparency = More Fairness

Robert Morse today announced that, in response to evidence that law schools had been gaming its rankings, U.S. News would change the way it estimates the "Employment at 9 Months" measure for schools that decline to report that figure. Paul Caron offers some background here. Said Morse: "U.S. News is planning to significantly change its estimate for the at-graduation rate employment for nonresponding schools in order to create an incentive for more law schools to report their actual at-graduation employment rate data. This new estimating procedure will not be released publicly before we publish the rankings."

I understand that U.S. News generated the formula it formerly used to estimate the Emp9 figure for non-reporting schools by running a regression comparing the Emp0 and Emp9 data from reporting schools. It used to puzzle me that U.S. News did not evidently re-run the regression each year, but rather stuck with the original estimate. In retrospect, though, I see that sticking to the same formula might have partially helped U.S. News offset the gaming it so dislikes. After all, as more and more schools with low numbers refused to report Emp9 data, opting to rely instead on the publicized formula, the correlation between Emp0 and Emp9 scores would change so as to favor non-reporting schools. Better to stick with the old formula, dated though it might be, than to increase the incentive to opt out of reporting.

U.S. News thus avoided a vicious cycle, but only at the cost of signaling to schools exactly when hiding Emp9 data would help their rankings. Will its new reticence work? Schools can now only guess at how U.S. News will turn Emp0 numbers into Emp9 estimates, and will rightly worry that they might misjudge the new cutoff. Even if big-E ethics does not counsel reporting Emp9 numbers, therefore, small-c conservatism will. Granted, a school might reason, "U.S. News will still try to find a reasonably accurate way to turn Emp0 data into Emp9 estimates, and it has always helped us to not report in the past, so it remains a gamble worth taking." But such schools should also rightly worry that U.S. News might throw a punitive little kick into its new formula, to encourage schools to worry more about accuracy than about rankings.

[Crossposted at Agoraphilia and MoneyLaw.]

Labels: ,

Monday, August 31, 2009

How Top-Ranked Law Schools Got That Way, Pt. 3

Part one and part two of this series focused on the top law schools in U.S. News and World Report's 2010 rankings, offering graphs and analysis to explain why those schools did so well. This part rounds out the series by way of contrast. Here, we focus on the law schools that ranked 41-51 in the most recent USN&WR rankings, those that ranked 94-100, and the eight schools that filled out the bottom of the rankings.

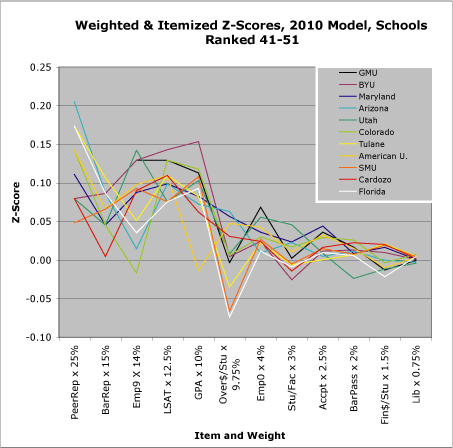
Weighted & Itemized Z-Scores, 2010 Model, Schools Ranked 41-51

The above chart shows the weighted and itemized z-scores of law schools about 1/3rd of the way from the top of the 2010 USN&WR rankings. Note the sharp downward jog at Over$/Stu—a residual effect, perhaps, of the stupendously large Over$/Stu numbers we earlier saw among the very top schools. Note, too, that three schools here—GMU, BYU, and American U.—buck the prevailing trend by earning lower scores under PeerRep than under BarRep (GMU's line hides behind BYU's). As you work down from the top of the rankings, GMU offers the first instance of that sort of inversion; all of the more highly ranked schools have larger itemized z-scores for PeerRep than for BarRep. It raises an interesting question; Why did lawyers and judges rank those schools so much more highly than fellow academics did?


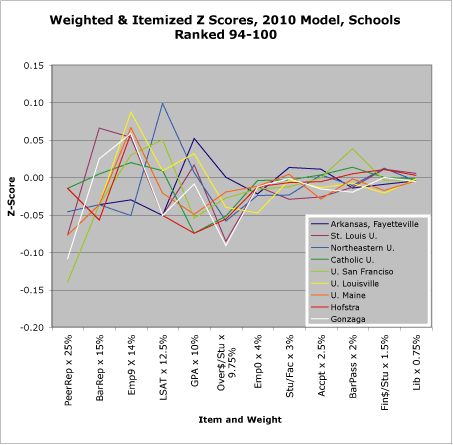
Weighted & Itemized Z-Scores, 2010 Model, Schools Ranked 94-100

The above chart shows the weighted, itemized z-scores of the law schools ranked 94-100 in the 2010 USN&WR rankings—about the middle of all of the 182 schools in the rankings. As we might have expected, the lines bounce around more wildly on the left, where they trace the impact of the more heavily weighted z-scores, than on the right, where z-scores matter relatively little, pro or con. Beyond that, however, no one pattern characterizes schools in this range.


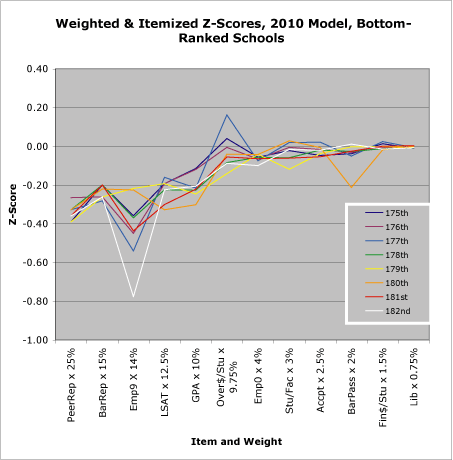
Weighted & Itemized Z-Scores, 2010 Model, Bottom-Ranked Schools

The above chart shows the weighted and itemized z-scores of law schools that probably did the worst in the 2010 USN&WR rankings. I say, "probably," because USN&WR does not reveal the scores of schools in the bottom two tiers of its rankings; these eight schools did the worst in my model of the rankings. Given that uncertainty, as well as for reasons explained elsewhere, I decline to name these schools.

Here, as with the schools at the very top of the rankings, we see a relatively uniform set of lines. All of the lines trend upward, of course. These schools did badly in the rankings exactly because they earned strongly negative z-scores in the most heavily weighted categories, displayed to the left. Several of these schools did very badly on the Emp9 measure, and one had a materially poor BarPass score. Another of them did surprisingly well on Over$/Stu, perhaps demonstrating that, while the very top schools boasted very high Over$/Stu scores, no amount of expenditures-per-student can salvage otherwise dismal z-scores.

[Crossposted at Agoraphilia, MoneyLaw.]

Labels: ,

Sunday, August 23, 2009

How Top-Ranked Law Schools Got That Way, Pt. 2

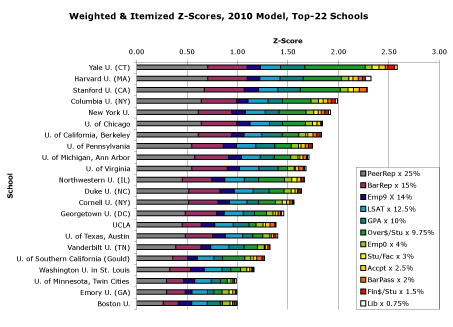
In the first post in this series, I discussed the mysterious distribution of maximum z-scores in the top two tiers of law schools in U.S. News & World Report's 2010 rankings, and focused on the top-12 schools to solve that mystery. In brief, among the very top schools, employment nine months after graduation" ("Emp9") varies too little to make much of a difference in the schools' overall scores, whereas overhead expenditures/student ("Over$/Stu") varies so greatly as to almost swamp the impact of the other factors that USN&WR uses in its rankings. Here, in part two, I focus on the top 22 law schools in USN&WR's 2010 rankings. In addition to the Emp9 and Over$/Stu effects observed earlier, this wider study uncovers some other interesting patterns.

Weighted & Itemized Z-Scores, 2010 Model, Top-22 Schools

The above graph, "Weighted & Itemized Z-Scores, 2010 Model, Top-22 Schools," offers a snapshot comparison of how a wide swath of the top schools performed in the most recent USN&WR rankings. It reveals that the same effects we observed earlier, among just the top-12 schools, reach at least another ten schools down in the rankings. With the exception of Emory and Georgetown, Emp9 scores (indicated by the dark blue band) barely change from one top-22 school to another. Over$/Stu scores, in contrast (indicated by the middle green hue), vary widely; compare Yale's extraordinary performance on that measure with, for instance, Boston University's.

This graph also reveals some other interesting effects. Like the Emp9 measure, the Emp0 measure (for "Employment at Graduation," indicated in yellow-green) varies little from school to school. Indeed, it varies even less than the Emp9 measure does. Why so? Because all of these top schools reported such high employment rates. All but Minnesota reported Emp0 rates above 90%, and all but Georgetown, USC, and Washington U. reported rates above 95%.

These top 22 schools also reported very similar LSATs. Their weighted z-scores for that measure, indicated here in light blue, range from only.20 to .15. The weighed z-scores for GPA, in contrast, marked in dark green, range from .24 to .06.

As the graph indicates, the measures worth 3% or less of a school's overall score—student/faculty ratio, acceptance rate, Bar exam pass rate, financial aid expenditures/student, and library volumes and equivalents—in general make very little difference in the ranking of these schools. One exception to that rule pops up in the BarPass scores (in dark orange) of the California schools, which benefit from a quirk in the way that USN&WR measures Bar Pass rates. Another interesting exception appears in Harvard's Lib score (in white)—only thanks to its vastly larger law library does Harvard edge out Stanford in this ranking.

To best understand how a few law schools made it to the top of USN&WR's rankings, we should contrast their performances with those of the many schools that did not do as well. I'll thus sample the statistics of the law schools that ranked 41-51 in the most recent USN&WR rankings, those that ranked 94-100, and the eight schools that filled out the bottom of the rankings. Please look for that in the next post.

[Crossposted at Agoraphilia, MoneyLaw.]

Labels: ,

Thursday, August 20, 2009

How Top-Ranked Law Schools Got That Way, Pt. 1

How do law schools make it to the top of the U.S. News & World Report rankings? USN&WR ranks law schools based on 12 factors, each of which counts for a certain percentage of a school's total score. Peer Reputation counts for 25% of each law school's overall score, for instance, whereas Bar Passage Rate counts for only 2%. More precisely, USN&WR calculates z-scores (dimensionless statistical measures of relative performance) for each of the 12 factors for each school, multiplies those z-scores by various percentages, and sums each school's weighted, itemized z-scores to generate an overall score the school. USN&WR then rescales the scores to run from 100 to zero and ranks law schools accordingly.

In earlier posts I described my model of the most recent U.S. News & World Report law school rankings (the "2010 Rankings"), quantified its accuracy, and published itemized z-scores for the top two tiers of schools. (Separately, I also suggested some reforms that might improve the rankings.) Studying those z-scores reveals a great deal about how the top-ranked law schools got that way. The lessons hardly jump out from the table of numbers, though, so allow me to here offer some illustrative graphs.

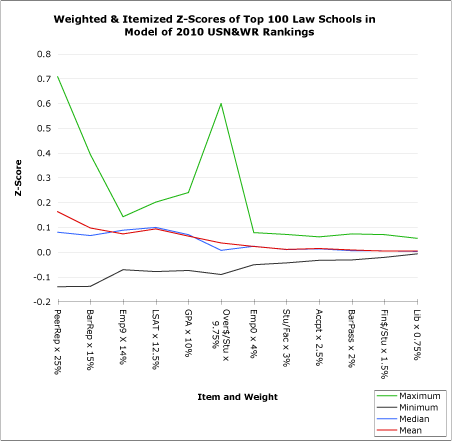
Weighted & Itemized Z-Scores of Top 100 Law Schools in Model of 2010 USN&WR Rankings

The above graph, "Weighted & Itemized Z-Scores of Top 100 Law Schools in Model of 2010 USN&WR Rankings," reveals an interesting phenomenon. The items on the left of the graph count for more of each school's overall score, whereas the items on right count for less. We would thus expect the line tracing the maximum weighted z-scores for each item to drop from a high, at PeerRep (a measure of a school's reputation, worth 25% of its overall score), to a low, at Lib (a measure of library volumes and equivalents, worth only .75%). Instead, however, the maximum line droops at Emp9 (employment nine months after graduation) and soars at Over$/Stu (overhead expenditures per student). The next graph helps to explain that mystery.

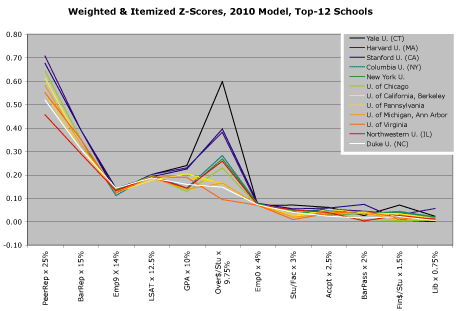
Weighted & Itemized Z-Scores, 2010 Model, Top-12 Schools

The above graph, "Weighted & Itemized Z-Scores, 2010 Model, Top-12 Schools," reveals two notable phenomena. First, the Emp9 z-scores, despite potentially counting for 14% of each school's overall score, lie so close together that they do little to distinguish one school from another. In practice, then, the Emp9 factor does not really affect 14% of these law schools' overall scores in the USN&WR rankings. (Much the same holds true of top schools outside of these 12, too.)

Second, the Over$/Stu z-scores range quite widely, with Yale having more than double the score of all but two schools, Harvard and Stanford, which themselves manage less than two-thirds Yale's Over$/Stu score. That wide spread gives the Over$/Stu score an especially powerful influence on Yale's overall score, making it almost as important as Yale's PeerRep score and much more important than any of the school's remaining 10 z-scores. In effect, Yale's extraordinary expenditures per student buy it a tenured slot at number one. (I observed a similar effect in last year's rankings.)

Other interesting patterns appear in "Weighted & Itemized Z-Scores, 2010 Model, Top-12 Schools." Note, for instance, that Virginia manages to remain in the top-12 despite an unusually low Over$/Stu score. The school's strong performance in other areas makes up the difference. Though it is not easy to discern from the graph, Virginia's reputation and GPA scores fall in the middle of these top-12 schools' scores. Northwestern offers something of a mirror image on that count, as it remains close to the bottom of the top-12 despite a disproportionately strong Over$/Stu score. The school's comparatively low PeerRep and BarRep scores (the lowest of those in the top-12) and GPA (nearly tied for the lowest) score pull it down; Northwestern's Over$/Stu score saves it.

[Since I find I'm running on a bit, I'll offer some other graphs and commentary in a later post or posts.]

[Crossposted at Agoraphilia, MoneyLaw.]

Labels: ,

Tuesday, August 04, 2009

Reforms Suggested by Modeling the Law School Rankings

As I recently observed, the close fit between law schools' scores in U.S. News & World Report's rankings and the scores of those same schools in my model of the ranking "suggests that law schools did not try game the rankings by telling USN&WR one thing and the ABA . . . another." Since both Robert Morse, Director of Data Research for USN&WR, and the ABA Journal saw fit to comment on that observation, perhaps I should clarify a few points.

First, I have no way of knowing whether or not law schools misstated the facts, by accident or otherwise, to both the ABA and USN&WR. The fit between USN&WR's scores and my model's scores indicates only that law schools reported, or misreported, the same facts to each party.

Second, this sort of consistency test speaks only to those measures USN&WR uses in its rankings, that it does not publish with its rankings, and that the ABA collects from law schools: median LSAT, median GPA, overhead expenditures/student, financial aid/student, and library size. Measures that USN&WR uses and publishes—reputation among peers and at the Bar, employment nine months after graduation, employment at graduation, student/faculty ratio, acceptance rate, and Bar exam performance—go straight into my model, so I do not have occasion to test their consistency against ABA data. In some cases—the reputation scores and the employment at graduation measure, the ABA does not collect the data at all. This proves especially troubling with regard to the latter. We have little assurance that USN&WR double-checks what schools report under the heading of "Employment at Graduation," and no easy way to double-check that data ourselves.

Third, and consequently, USN&WR could improve the reliability of its rankings by implementing some simple reforms. I suggested three such reforms some time ago. USN&WR has largely implemented two of them by making its questionnaire more closely mirror the ABA's and by publishing corrections and explanations when it discovers errors in its rankings. (I claim no credit for that development, however; I assume that USN&WR acted of its own volition and in its own interest.)

Another of my suggested reforms remains as yet unrealized, however, so allow me to repeat it, here: USN&WR should publish all of the data that it uses in ranking law schools. It could easily make that data available on its website, if not in the print edition of its rankings. Doing so would both provide law students with useful information and allow others to help USN&WR double-check its figures.

To that, I now add this proposed reform: USN&WR should either convince the ABA to collect data on law school graduates' employment rates at graduation or discontinue using that data in its law school rankings. That data largely duplicates the more trustworthy (but still notoriously suspect) "Employment at Nine Months" data collected by the ABA and used by USN&WR in its rankings. And, unlike that data, law schools do not report "Employment at Graduation" numbers under the threat of ABA sanctions. We cannot trust the employment at graduation figures and USN&WR does not need them.

Among the reforms I suggested some two years ago I also included one directed at the ABA, calling on it to publish online, in an easily accessible format, all of the data that it collects from law schools and that USN&WR uses in its rankings. I fear that, in contrast to USN&WR, the ABA moved retrograde on that front. I leave that cause for another day, however; here I wanted to focus on what my model can tell us about USN&WR's rankings.

[Crossposted at Agoraphilia, MoneyLaw.]

Labels: ,

Thursday, July 23, 2009

Z-Scores in Model of 2010 USN&WR Law School Rankings

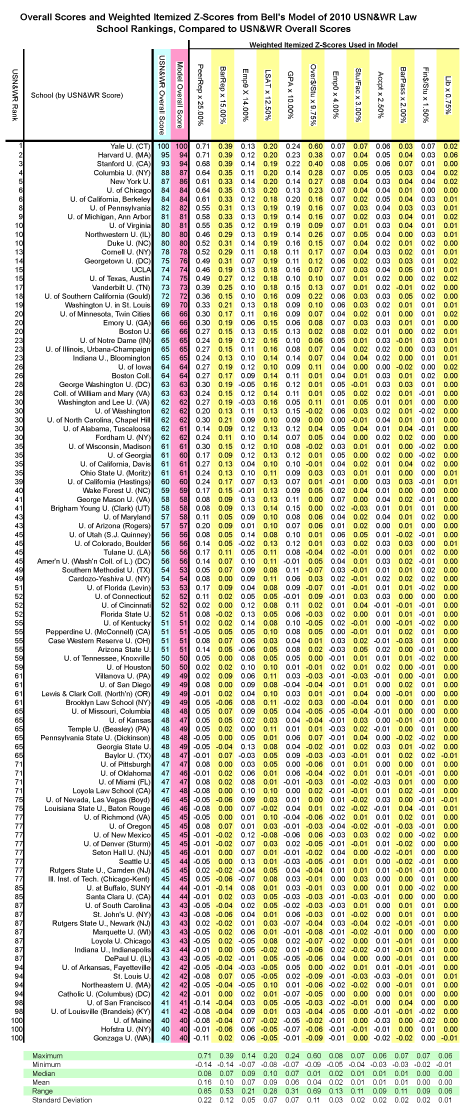
If you want to know how U.S. News & World Report's law school rankings work, you'll want to know about z-scores. In very brief, z-scores measure how well each school performed relative to its peers, thereby establishing its rank. (See here for a fuller explanation.) My model of the rankings aims to recreate those z-scores, and thus the rankings themselves, by duplicating both the data and the methodology that USN&WR uses. Here are the results for the law schools most recently ranked in the top 100:

Z-Scores from Model of USN&WR 2010 Law School Rankings

For cross-year comparisons, please see the similar reports I offered in 2005, 2006, 2007, and 2008. This year, in response to a reader's request, I've added various diagnostic measures, such as the mean, median, and standard deviation of each itemized category of data. As I did last year, I again provided weighted z-scores, meaning simply that I've multiplied the z-scores in each category of data by the percentage that category influences a school's overall score. That method of presenting z-scores has the virtue of highlighting which scores matter the most.

Unsurprisingly, you'll generally find the largest numbers in the upper, left-hand corner of the chart. There lie the most heavily-weighted z-scores of the law schools that scored the highest in USN&WR's rankings. Consider, for instance, the .71 weighted z-scores enjoyed by Yale and Harvard under the "PeerRep" category; those numbers nearly swamp the effect of other measures of those schools' performances, and have twice the impact of the peer reputation scores of schools ranked as close as 20th from the top.

This presentation of the data also shows how very little influence many of the things that USN&WR measures have on its rankings. The weighted z-scores for Bar pass rates, for instance, vary between only .07 and -.02, with a whole lot of zeros filling that span. Bar passage rates evidently do not matter much to any school's USN&WR score.

Rankings geeks will doubtless find close study of this table rewarding. I'm especially interested in the surprising impact of the top schools' overhead expenditures/student—a phenomenon that I discussed in some detail last year. Perhaps I'll return to that topic, and raise some new ones, in later posts. In the meantime, I welcome your own observations.

[Crossposted at Agoraphilia, MoneyLaw.]

Labels: ,

Wednesday, July 22, 2009

Accuracy of the Model of the 2010 USN&WR Law School Rankings

I earlier offered a snapshot comparison of the scores generated by my model of the 2010 U.S. News & World Report law school rankings and the original. After Robert Morse, director of data research for USN&WR, asked me if I could quantify the fit between the two data sets, I realized that others might share his curiosity. Here, then, are the r-squared measures (more precisely, the squares of the Pearson product moment correlation coefficients) for each of the models I've done over the past few years:

2010 rankings: 0.999
2009 rankings: 0.999
2008 rankings: 0.999
2007 rankings: 0.997
2006 rankings: 0.995

What do those numbers mean? In brief, an r-squared closer to 1 (or –1) shows a closer fit between the two data sets. It might seem a bit absurd to report these results out to three decimals, but I wanted to make clear that the model has yet to obtain results absolutely identical to those reported by USN&WR. I daresay, though, that any r-squared above .99 shows a pretty strong correlation.

[Crossposted at Agoraphilia and MoneyLaw.]

Labels: ,

Thursday, July 16, 2009

A Model of the 2010 USN&WR Law School Rankings

As in every year since 2005, I this year again built a model of the law school rankings published by the U.S. News & World Report ("USN&WR"). Figuring out the rankings—the "2010" rankings, as USN&WR's calls them—proved especially trying this time around. USN&WR changed several parts of its methodology this year and the ABA, which distributes statistical data on which my model depends, fell far behind its usual publication schedule. Finally, though, the model ended up generating scores gratifyingly close to those that USN&WR assigned law schools. Here's a snap-shot comparison of the results:

Chart of Accuracy of Model of USN&WR 2010 Law School Rankings

For details about how and why I modeled USN&WR's law school rankings, as well as for similar snap-shots, see these posts from 2005, 2006, 2007, and 2008.

Perhaps in later posts I'll offer some reflections on what this year's model of the USN&WR rankings teaches. For now, I'll just offer this happy observation: The close fit between USN&WR's scores and the model's scores suggests that law schools did not try game the rankings by telling USN&WR one thing and the ABA (the source of much of the data used in my model) another. Even a skeptic of law school rankings can find something to like in that.

[Crossposted at Agoraphilia and MoneyLaw.]

Labels: ,

Wednesday, October 15, 2008

Voter Fraud in U.S. News Surveys?

In ranking law schools, U.S. News and World Report weights peer reputation more heavily than any other measure of quality. A school's reputation among its peers counts for 25% of its overall score in the rankings (the next-most important measure, in contrast, counts for only 15%). How does USN&WR calculate a school's peer reputation? It says that it relies on surveys sent to "law school deans, deans of academic affairs, the chair of faculty appointments, and the most recently tenured faculty members" of each of the ABA-accredited law schools that it ranks. In truth, however, other people also get the chance to vote on USN&WR's reputation surveys.

Two people recently and independently told me that they had received USN&WR reputational surveys even though they do not fit any of the criteria—law school dean, dean of academic affairs, etc.—that USN&WR has published. Both people work at law schools. One of my informants told me that he/she got the forms both at his/her present employer and at a law school she worked at earlier. My other informant told me that he/she knows of a similarly situated person who likewise got an apparently unauthorized USN&WR reputation survey. Both informants asked that I not identify them—hence my coy phrasing—but their claims strike me as completely credible.

Those few anecdotes do not, of course, establish how often USN&WR sends reputation surveys to people other than those it (says it) intends to poll. Notably, however, the reports I've received came to me unbidden, simply because I have a reputation as a rankings geek. Query how many more such cases a comprehensive investigation would uncover; a lot, I'd guess.

Query, too, whether USN&WR really means to send surveys to people such as those who contacted me. Perhaps it has a "secret list" of reputation survey recipients, people whose opinions it holds in high regard but whom it wants to safeguard from the taint of law school public relations campaigns designed to influence USN&WR voters. Yet another caveat: Perhaps USN&WR manages to screen out reputation surveys that get filled out and returned by unqualified parties.

We thus have, as yet, no solid proof that voter fraud materially affects the way that USN&WR ranks law schools. We do, however, have reason to wonder whether the most important part of USN&WR's rankings really works as advertised.


[Crossposted at Agoraphilia, MoneyLaw, and College Life O.C.]

Labels:

Sunday, October 12, 2008

What IS a good part-time program?

Over on my own blog, I've talked a bit about the new part-time program rankings that USNWR is proposing and the new part of this year's questionnaire that asks voters to name up to 15 "good" part-time programs (see here). Setting aside the misnomer--most of the students in the part-time programs work about full-and-a-half-time, between their "day jobs" and studying for law schools--I have to wonder what constitutes a "good" part-time program.

Is it the availability of good teachers for the program? A good selection of classes? Mentoring for the part-time students? The ability to provide the students with some semblance of the extracurricular activities that the full-time students experience? How well the graduates perform? Whether enough of the graduates get plum jobs after graduation?

This question is timely for two reasons: because it's the right question for educational reasons and because other USNWR voters are filling out their ballots now. I'd love to hear your thoughts.

Labels: ,

Wednesday, September 24, 2008

LSAT-Free Law School Admissions

The University of Michigan School of Law recent announced an innovative program to admit 1L law students who have never taken an LSAT exam. Under the Wolverine Scholars program, potential admits with especially good undergraduate records from the University of Michigan—Ann Arbor campus may apply for admission to the law school without having taken the LSAT. That is not just an option, either; it is a requirement. "In order to be considered for the Wolverine Scholars program, applicants must not yet have taken the LSAT," explains the law school.

How, then, can the law school trust that the Wolverine Scholars program will bring in qualified students? It doubtless helps that only students of the University of Michigan, an excellent undergraduate institution, qualify. To hedge its bets, though, the law school also requires that students applying as Wolverine Scholars have and maintain a cumulative UM grade point average of at least 3.80. (By way of comparison, the law school last year reported that its 1Ls had a mean GPA of 3.64.)

The Wolverine Scholars program doubtless has many virtues. I wonder, though, if the University of Michigan law school counts among them an opportunity to improve its performance in the U.S. News and World Report rankings. After all, the law school can hardly report LSAT scores for its IL Wolverine Scholars if no such scores exist. Yet those same students offer the school a chance to greatly improve the mean GPA of its IL class.

I predict that many more schools will soon emulate the University of Michigan's Wolverine Scholars program—unless, of course, USN&WR changes its ranking methodology to take away the advantage that LSAT-free admissions offers. USN&WR probably will not do so, however, because it relies in large part on ABA-defined categories of data. So unless the ABA reacts to LSAT-free admissions programs by changing how it measures GPAs, USN&WR will probably not rock the boat.


(HT: My Chapman colleague, and UM law school alum, Denis Binder.)

[Crossposted at Agoraphilia, MoneyLaw, and College Life O.C.]

Labels: , ,

Friday, September 19, 2008

Want Your School to Rise in the Rankings? A Best Practices Survey For Law Schools

You might not want your school to rise, I don't know. But if you do, you might encourage your dean or associate dean to fill out this survey on your school's use of best practices in legal education, which along with information on bar passage rates relative to entering credentials, and student satisfaction, will be used to compile a list of law schools that provide exceptional "value added" for students.

Who's doing this? A couple of Moneyball-oriented law professors -- myself and Dave Fagundes of Southwestern Law -- with a dream: of law schools competing on educational quality, and a Race To The Top that improves legal education across the board. We're joined by a terrific Advisory Board, still in formation, that includes fomer deans like Daniel Rodriguez, former San Diego dean now at Texas, and fellow MoneyLaw blogger Nancy Rapoport, former dean at Houston and Nebraska/now at UNLV, as well as leading scholars on legal education and other topics like Susan Sturm (Columbia) and Bill Henderson (Indiana).

After compiling the list of "value-added" schools, we're going to deliver the information to U.S. News survey respondents, and encourage them to use it in filling out the survey in November. One possibility is that the value-added data will show that certain schools that have not historically received high ratings ought to receive a "4" or "5" from both law professors and lawyers. Given the current lack of information about the relative quality of law schools, and the weight given to the survey responses in U.S. News's methodology (40%) we believe that this additional information will have a significant — and positive — effect on the U.S. News rankings for those schools that we highlight.

Are you a dean, associate dean for academic affairs, chair of the hiring committee, most recently tenured professor, law firm hiring partner, state AG, or federal or state judge? That's who gets the U.S. News survey, and you can sign up for our Voter's Guide in a second at our new website, designed by UGA 2L Jerad Davis. We'll email it to you in November when the USN survey comes out, and if you have other ideas as to how we can help you do the survey, please let us know. For example, we may put on our website a spreadsheet where you can sort the schools by region to compare within the relevant markets.

Even if you're not one of the USN voters listed above, maybe you know one, and suspect they may not be a regular MoneyLaw reader — please, forward them this link to our site, and encourage them to sign up! Future law students will thank you, and so will we.

MoneyLaw readers might recall my blogging over the summer on this idea of value-added assessment, and now we're trying to make it a reality. It's a distinctively Moneyball concept — using performance, not pedigree, in assessing law schools — and we owe some serious thanks to Jim Chen for launching this blog in the first place, and then for hosting us here. Other godparents of the project include, of course, Paul Caron and Rafael Gely, whose classic article applying Moneyball principles to legal education got many of us thinking in this direction.

We hope you'll join the continued discussion about how best to assess relative educational quality, and specifically which schools ought to be rated particularly high or low — and encourage law professors and lawyers to use this kind of approach in doing the survey. Welcome your ideas.

Cross-posted at Prawfsblawg and Race to the Top

Labels: , ,